Turning a KQL hunting query into a Defender detection rule to spot unusual web server processes using simple statistics.
This is a quick follow-up on a previous article where I explored the topic of Baselines in more detail, consider checking it before this one.
Here, I highlight a simple yet very powerful technique to find potential web shells based on the low-prevalence of every successful attack scenario.
In the end, you will have a fully functional hunting and detection query.

With that in mind, let's start by defining a Hunting Hypothesis:
If an attacker exploits an internet-facing web server, the activity will generate unique traces in the logs, which can be identified through specific patterns or anomalies.
That's a very high-level one. What if we refine it a little bit? For instance, let's narrow it down to the following:
If an attacker successfully exploits a web server, the compromised process may spawn an unusual child process, which can be easily spotted when compared it to a baseline of common child processes.
Of course, that might become even more specific.
For now, let's assume the web server daemon is running on a Windows host and the common daemons or web server processes arew3wp.exe for IIS, httpd.exe for Apache, or nginx.exe for Nginx.
What's an Ephemeral Baseline?
In the previous article, the baseline is defined as a dataset that reflects the “normal” or expected pattern in data, used as a reference to detect changes, trends, or anomalies.
Usually, a baseline is persisted on disk just like a table in a database so that it can be later consumed. That requires a dedicated job (or query) to create and update such table or dataset.

What if we want to build it on-the-fly and simply discard it after use?
That is, what if we can bake that into a hunting or a detection query? That's what I call an ephemeral baseline, a transient, short lifespan artifact.
Building the Hunting & Detection Queries
In this case, I’ll use Kusto Query Language (KQL) and tap into the gold mine of command-line log telemetry available from the Defender platform.
Any serious threat hunter working with Microsoft Sentinel or Defender XDR knows I am referring to the Device*Events tables.
The idea is to summarize the relevant data, just like you would when designing and building a baseline and combine that with carefully crafted thresholds to narrow the results to potential hunting leads or alerts.
Understand the data
Here we're goin gto pick the DeviceProcessEvents table.
To visualize which fields and what kind of artifacts are available, use the following KQL query to visualize 10 random records from that table:
DeviceProcessEvents | take 10
And here are the field candidates:
- InitiatingProcessParentFileName: Name of the parent process that spawned the (child) process responsible for the event.
- InitiatingProcessFileName: the main object of this hunt, the child process name.
- InitiatingProcessCommandLine: this contains the full command line used by the (child) process.
- DeviceId/DeviceName: that's used to identify the affected web server host. Since the same name can be used, it's safer to pick the ID.
With that, we are already able to summarize the data given any combination of parent/child process.
For instance, the following KQL query generates a dataset containing the number of distinct devices seen per parent and child process within the last 24 hours:
DeviceProcessEvents
| where Timestamp > ago(24h)
| summarize deviceCount=dcount(DeviceId)
  by InitiatingProcessParentFileName InitiatingProcessFileName
Note that I am using Defender's Timestamp as the time reference field. You may need to replace that with TimeGeneratedif using Sentinel.
What if, instead of querying for the last 24 hours, we need to analyze logs from the past 30 days?
Depending on the size of the environment, simply increasing the time period leads to a high performance impact on the system, sometimes becoming prohibitive.
One of the solutions is to add more constraints to avoid a performance hit.
So instead of looking for all processes pairs, we look only for a subset of them, focusing on the previously defined hunting hypothesis.
And here are the constraints:
- Windows-based web servers
- Common web server processes (parents)
- Low-prevalence, unusual processes (children)
Device Attributes
The platform provides a table called DeviceInfo that records device attributes. That makes it another source for finding extra constraints.
Among the attributes, there's one that indicates whether a host is internet-facing or not, a particularly useful piece of information in this scenario.
To get a list of unique internet-facing, Windows devices, use this one:
DeviceInfo
| where IsInternetFacing == true and OSPlatform startswith "Windows"
| distinct DeviceId
Building a Baseline
Now, to build a baseline for a longer period of time and narrowing it down to the scenario described before, here's a revised KQL query:
let CommonDaemons = dynamic(['w3wp.exe', 'httpd.exe', 'nginx.exe']);
let WinWebServers =
DeviceInfo
| where IsInternetFacing == true and OSPlatform startswith "Windows"
| distinct DeviceId;
search in(DeviceProcessEvents) ('w3wp' or 'httpd' or 'nginx')
| where Timestamp > ago(30d)
| where InitiatingProcessParentFileName has_any(CommonDaemons)
| where DeviceId has_any(WinWebServers)
| extend day = bin(Timestamp, 1d)
| summarize dayCount=dcount(day), deviceCount=dcount(DeviceId)
  by InitiatingProcessParentFileName, InitiatingProcessFileName
As you can see, the two tables are now combined in such way that the output from DeviceInfo is used as a constraint in the main DeviceProcessEvents search.
Note that the search command contains a bloomfilter which will significantly lower the performance impact while providing faster results!
The day field is created by binning the Timestamp value into a day format, which enables counting the number of days observed per process pair.
The last command (summarize) performs the main analytical task: it compresses the data based on the prevalence of parent and child process by counting the number of unique devices observed per process pair.
The result should look like this:
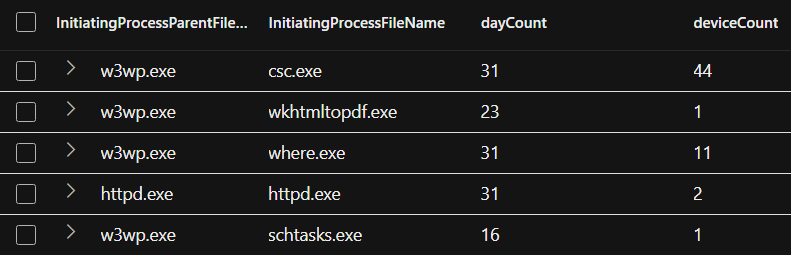 Quick baseline of parent/child processes seen from internet-facing, Windows servers.
The obvious idea here is to leverage the infamous “long tail” analysis — examining processes that appear at the low end of the distribution.
That means analyzing parent-child process relationships that occur on fewer hosts, especially the ones occurring in a single day.
Still, depending on the organization size and its Windows web server footprint, this might be a very long list. So what else can be done here?
Final Hunting Query
There are a few key things missing besides reducing the data sample. The dataset lacks the following key information:
- The last time a record has occurred
- The full command lines involved
That can be easily added by modifying the summarize operator:
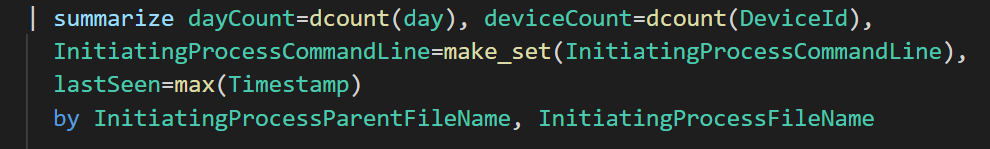 KQL's summarize make_set() is the SPL's stats values() equivalent
Now, in case you don't want to inspect the full list, simply add a threshold:
let CommonDaemons = dynamic(['w3wp.exe', 'httpd.exe', 'nginx.exe', 'tomcat.exe']);
let WinWebServers =
DeviceInfo
| where IsInternetFacing == true and OSPlatform startswith "Windows"
| distinct DeviceId;
search in(DeviceProcessEvents) ('w3wp' or 'httpd' or 'nginx' or 'tomcat')
| where Timestamp > ago(30d)
| where InitiatingProcessParentFileName has_any(CommonDaemons)
| where DeviceId has_any(WinWebServers)
| extend day = bin(Timestamp, 1d)
| summarize dayCount=dcount(day), deviceCount=dcount(DeviceId),
  InitiatingProcessCommandLine=make_set(InitiatingProcessCommandLine),
  lastSeen=max(Timestamp)
  by InitiatingProcessParentFileName, InitiatingProcessFileName
| where dayCount<=2 and deviceCount<=2
That last line reduces the amount of results to the ones happening less often and observed from fewer hosts. You can also sort it in the end.
Detection Prototype: add a pint of salt!
That query can be easily turned into a detection prototype! How? You need to come up with a better, stricter threshold.
Assuming this query will run periodically, you simply need to catch the very first time it outputs a new parent/child pair.
That can be done by checking if lastSeen falls within the current day AND if the dayCount is equal to 1!

That's done by adding the following where condition:
| where lastSeen >= startofday(now()) and dayCount == 1
Now, if you want to add that as an Advanced Hunting rule in Defender, the platform requires a few dedicated fields as part of their alert schema:
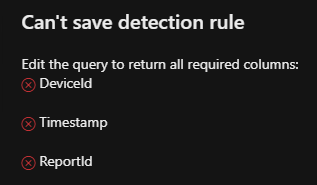 Defender field-set enforcement for detection rule creation
And here's how I go about that in this case:
- Timestamp
Add a min(Timestamp) to capture the earliest time the event happened. - DeviceId
Add a make_set(DeviceId) to collect all devices involved. - ReportId
Same approach as the previous one!
In the end, the detection rule will look like this:
let CommonDaemons = dynamic(['w3wp.exe', 'httpd.exe', 'nginx.exe', 'tomcat.exe']);
let WinWebServers =
DeviceInfo
| where IsInternetFacing == true and OSPlatform startswith "Windows"
| distinct DeviceId;
search in(DeviceProcessEvents) ('w3wp' or 'httpd' or 'nginx' or 'tomcat')
| where Timestamp > ago(30d)
| where InitiatingProcessParentFileName has_any(CommonDaemons)
| where DeviceId has_any(WinWebServers)
| extend day = bin(Timestamp, 1d)
| summarize dayCount=dcount(day), deviceCount=dcount(DeviceId),
  InitiatingProcessCommandLine=make_set(InitiatingProcessCommandLine),
  lastSeen=max(Timestamp),
  DeviceId=make_set(DeviceId),
  ReportId=make_set(ReportId),
  Timestamp=min(Timestamp)
  by InitiatingProcessParentFileName, InitiatingProcessFileName
| where lastSeen >= startofday(now()) and dayCount == 1
Key Takeaways
The main lesson here is that the baselining approach applies to multiple scenarios, from reporting, to hunting to detection workflows.
Ideally, the baseline should be created and updated as a distinct process, with one or multiple consumers and then saved to a permanent storage.
However, when resources allow, a baseline can also be created in-memory, as an ephemeral digital artifact, enabling faster prototyping.
There are multiple takeaways from this simple exercise, below I am listing two more which will hopefully inspire you for trying this out!
Spot the Unknown — without using a single hard-coded string
Hopefully you've noticed the detection doesn't look for a known bad or suspicious process name or file path.
Rather than using keyword or string matching, the logic spits out potential candidates based on their low prevalence or rarity given what's happened in the past (30 days) or what is considered normal — the baseline.
All that leads to very few, appealing alerts.
Now, imagine if you combine that with multiple indicators? That is just one. That's how powerful a detection model can be.
Enforcing Aggregation = Lower Alert Volume
The vast majority of teams (and poor products) will alert on every single instance of a suspicious process — sometimes, per host or user.
While that approach is fine for some cases, forcing yourself to ALWAYS use a summarize (KQL) or a stats (SPL) command within detection rules will make you think about the best aggregation strategy.
That means you need to clearly define what is the subject and the object of an an alert — topic for another article!
In case you're eager for this one, I wrote about what makes up a Solid SIEM Detection Query before, go check it out!
Written by Alex Teixeira, independent consultant (contractor)
My new stories are public in the first 24h after publication. So don’t forget to subscribe to get notified when new content comes out!

Also feel free to connect on LinkedIn where I drop quick Threat Hunting, Detection Engineering and Security Analytics insights.
Threat Hunting step-by-step: Collecting Web Shells using Ephemeral Baselines was originally published in Detect FYI on Medium, where people are continuing the conversation by highlighting and responding to this story.
Introduction to Malware Binary Triage (IMBT) Course
Looking to level up your skills? Get 10% off using coupon code: MWNEWS10 for any flavor.
Enroll Now and Save 10%: Coupon Code MWNEWS10
Note: Affiliate link – your enrollment helps support this platform at no extra cost to you.
Article Link: Threat Hunting step-by-step: Collecting Web Shells 🐚 using Ephemeral Baselines | by Alex Teixeira | Feb, 2025 | Detect FYI
1 post - 1 participant
Malware Analysis, News and Indicators - Latest topics


Post a Comment
Post a Comment